
Pre-Winter Sale Limited Time 75% Discount Offer - Ends in 0d 00h 00m 00s - Coupon code = simple75
Pass the Databricks Data Analyst Databricks-Certified-Data-Analyst-Associate Questions and answers with Dumpstech
A data analyst has been asked to use the below table sales_table to rank products within region by the sales.
Input table:
region product sales
WEST A 1880.59
EAST A 2045.99
EAST B 4583.23
WEST B 3391.19
The result of the query should look like this:
region product rank
EAST B 1
EAST A 2
WEST B 1
WEST A 2
Which query will accomplish this task?
A data analyst is attempting to drop a table my_table. The analyst wants to delete all table metadata and data.
They run the following command:
DROP TABLE IF EXISTS my_table;
While the object no longer appears when they run SHOW TABLES, the data files still exist.
Which of the following describes why the data files still exist and the metadata files were deleted?
A data analyst is troubleshooting a query in Databricks SQL that fails when processing large datasets and complex join operations. Logs indicate that the job consistently aborts due to resource constraint errors on the cluster.
Which Query Profile metric should the analyst use to identify the operator that is causing resource overuse?
What describes the variance of a set of values?
Which location can be used to determine the owner of a managed table?
An analyst writes a query that contains a query parameter. They then add an area chart visualization to the query. While adding the area chart visualization to a dashboard, the analyst chooses " Dashboard Parameter " for the query parameter associated with the area chart.
Which of the following statements is true?
Which of the following approaches can be used to connect Databricks to Fivetran for data ingestion?
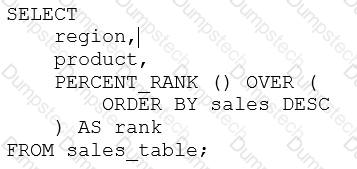
A data analyst has been asked to use the below table sales_table to get the percentage rank of products within region by the sales:
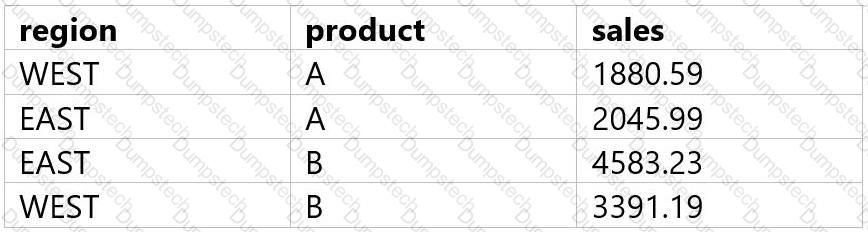
The result of the query should look like this:
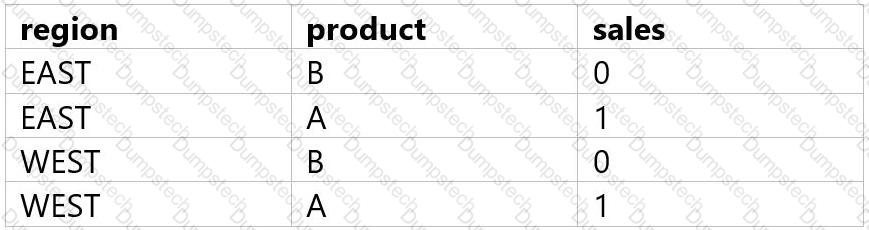
Which of the following queries will accomplish this task?
A)
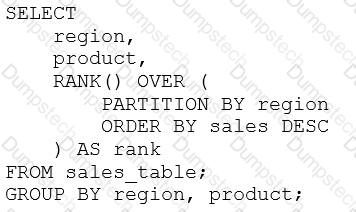
B)
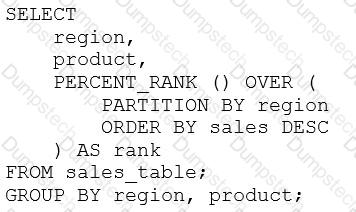
C)
D)
A data analyst has been asked to produce a visualization that shows the flow of users through a website.
Which of the following is used for visualizing this type of flow?
A data engineering team has created a Structured Streaming pipeline that processes data in micro-batches and populates gold-level tables. The microbatches are triggered every 10 minutes.
A data analyst has created a dashboard based on this gold level data. The project stakeholders want to see the results in the dashboard updated within 10 minutes or less of new data becoming available within the gold-level tables.
What is the ability to ensure the streamed data is included in the dashboard at the standard requested by the project stakeholders?
