
Summer Sale Limited Time 75% Discount Offer - Ends in 0d 00h 00m 00s - Coupon code = simple75
Pass the Salesforce Consultant Analytics-Con-301 Questions and answers with Dumpstech
Exam Analytics-Con-301 Premium Access
View all detail and faqs for the Analytics-Con-301 exam
A client has a pipeline dashboard that takes a long time to load. The dashboard is connected to only one large data source that is an extract.
It contains two calculated fields:
. TOTAL([Opportunities])
· SUM([Value])
It also contains two filters:
. A Relative Date filter on Created Date, a Date field containing values from 5 years ago until today
. A Multiple Values (Dropdown) filter on Account Name, a String field containing 1,000 distinct values
A consultant creates a Performance Recording to troubleshoot the issue, and finds out that the longest-running event is "Executing Query."
Which step should the consultant take to resolve this issue?
A shipping clerk wants to use a Sankey diagram to analyze the flow of goods between different categories, shipping modes, and locations to spot bottlenecks and optimize the most critical paths. The company uses Tableau Cloud.
How should the shipping clerk create a chart that depicts the above information?
A client wants to use a bar chart to visualize the trend in profit per quarter for the last 5 years. They want each bar's color to be determined by whether the profit during that quarter was greater than the median profit for the past four quarters, including the current quarter.
For example, if a bar represents profit for 2020 Q4, they want to visually see whether the profit for 2020 Q4 is greater than the median profit for 2020 Q1–2020 Q4.
Which table calculation should produce the desired result?
Which technique should a Tableau consultant use to make visualizations faster?
A client's dashboard has two sections dedicated to their shops and warehouses shown when a viewer chooses either shops or warehouses with a parameter.
There are a few quick filters that apply to both, while others apply to only shops or only warehouses.
Currently, the quick filters are all shown at the left side of the dashboard. The client wants to hide all filters, but when shown, make it easy for the viewer to
find the quick filters that work for only shops or only warehouses.
Which solution should the consultant recommend that meets the client's needs and is most user-friendly?
A consultant is creating a dashboard to report on hourly sales data. The data should be refreshed hourly and is used for timely decision-making, so it is important to alert dashboard viewers when data has not been refreshed.
Which feature of Tableau Catalog should the consultant use to ensure dashboard viewers understand this message?
A client is migrating their data warehouse. They visualize the data in workbooks hosted on Tableau Server with Tableau Data Management enabled and want to see how many workbooks will be impacted.
What should the consultant do to quickly identify how many workbooks will be impacted?
A transport and delivery company uses a command center dashboard in its logistics and distribution hubs. The dashboard is displayed on screens to show fleet movements, delivery status, and warehouse operations. The company needs the dashboard to provide up-to-date information without human intervention. The company's environment cannot access the internet, and the data source is configured to maintain a real-time connection.
How should the company meet this requirement?
A client wants to view stores serviced by delivery drivers on a map. The have the information provided in the table below:
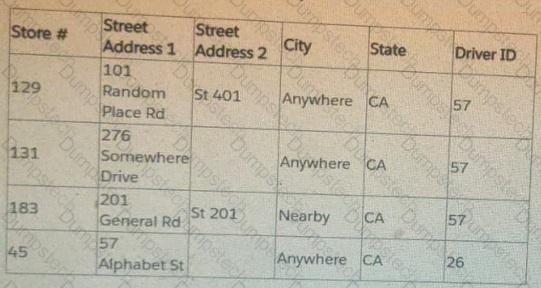
What does the client need to do to plot exact street addresses on the map?
A consultant is designing a dashboard that will be consumed on desktops, tablets, and phones. The consultant needs to implement a dashboard design that
provides the best user experience across all the platforms.
Which approach should the consultant take to achieve these results?