Summer Sale Limited Time 75% Discount Offer - Ends in 0d 00h 00m 00s - Coupon code = simple75

Pass the WGU Courses and Certificates Applied-Probability-and-Statistics Questions and answers with Dumpstech

Exam Applied-Probability-and-Statistics Premium Access

View all detail and faqs for the Applied-Probability-and-Statistics exam

Practice at least 50% of the questions to maximize your chances of passing.
Viewing page 2 out of 5 pages
Viewing questions 11-20 out of questions
Questions # 11:

A team of scientists wants to understand the relationship between smoking and lung cancer. They collect data from 1,000 individuals, recording their smoking habits and whether they have been diagnosed with lung cancer. The scientists then analyze the data to find any correlations.

Is this study observational or experimental?

Options:

A.

Experimental, because the researchers are analyzing the data to find correlations.

B.

Experimental, because the researchers are testing the effects of smoking on lung cancer.

C.

Observational, because the study involves a large sample size.

D.

Observational, because the researchers are collecting data without manipulating any variables.

Questions # 12:

A class of 25 students includes 10 who play soccer, 8 who play basketball, and 7 who play neither sport.

What is the probability of randomly selecting a student who does not play soccer?

Options:

A.

.30

B.

.40

C.

.50

D.

.60

Questions # 13:

Ten teachers each had a jar of jelly beans. The jars had this number of jelly beans in each respective jar: 50, 60, 80, 80, 100, 100, 100, 120, 120, and 140.

What is the mean of these data?

Options:

A.

100

B.

120

C.

80

D.

95

Questions # 14:

Type II error β is:

Options:

A.

Accept H₀ when false

B.

Reject H₀ when true

C.

1 − α

D.

Sample error

Questions # 15:

Type II error = ?

Options:

A.

Accept H₀ when false

B.

Reject H₀ when true

C.

Correct decision

D.

None

Questions # 16:

A study recorded the number of hours participants spent on exercise per week: 3 participants exercised for 1 hour, 6 participants exercised for 2 hours, 4 participants exercised for 3 hours, and 2 participants exercised for 4 hours.

Which type of graph would best represent the frequency of exercise hours?

Options:

A.

A line graph with points connected to illustrate changes in exercise hours over time

B.

A pie chart with slices representing the proportion of each exercise duration

C.

A bar chart with bars showing the number of participants for each exercise duration

D.

A scatterplot with points showing the relationship between exercise hours and fitness level

Questions # 17:

What is the product of 0.6 and 0.25?

Options:

A.

.15

B.

.18

C.

.20

D.

.22

Questions # 18:

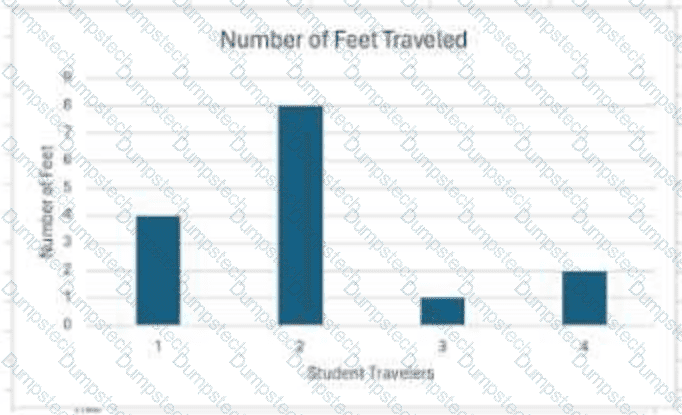
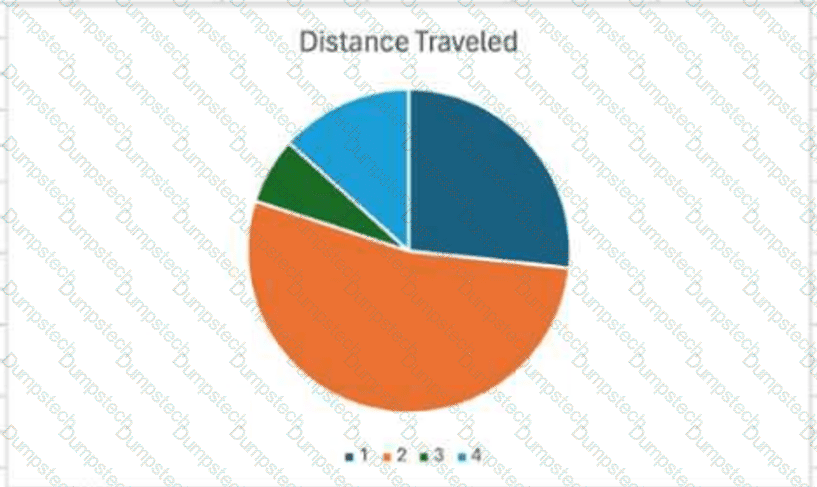
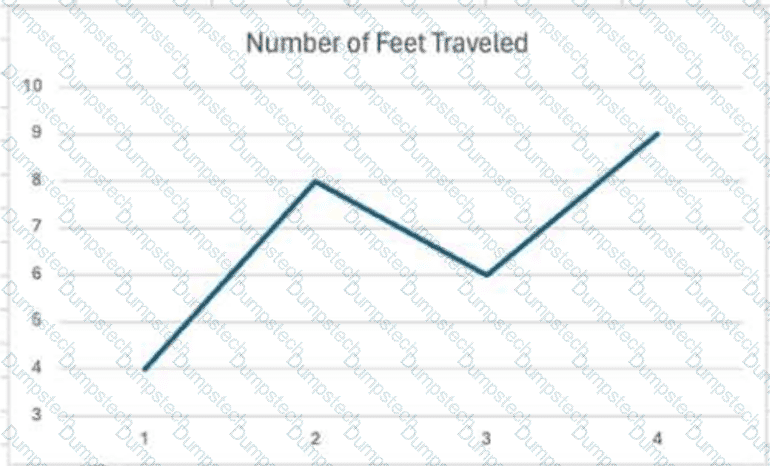
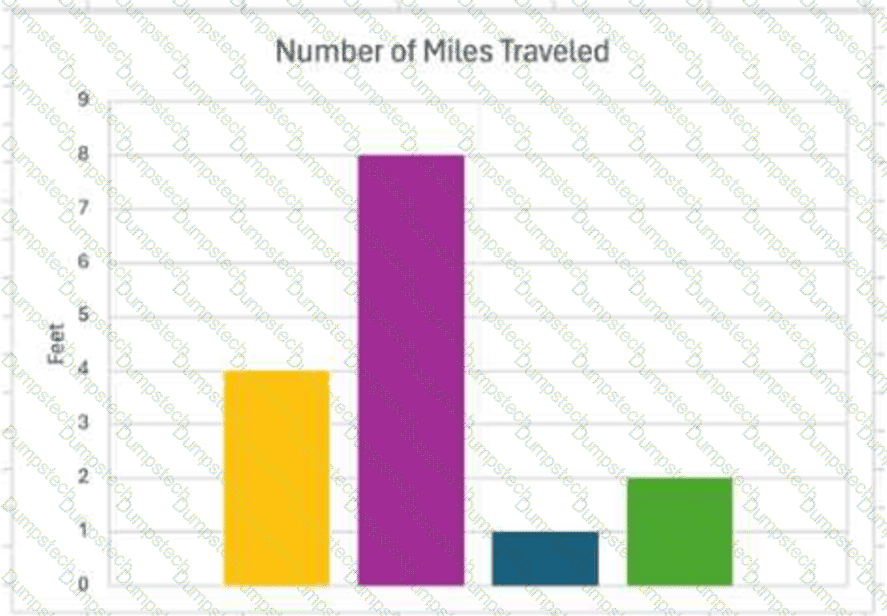
Which graph displays data in a manner that is accurate?
Question # 18

Question # 18

Question # 18

Question # 18

Options:

A.

Bar graph titled “Number of Miles Traveled,” with the vertical axis labeled in feet.

B.

Bar graph titled “Number of Feet Traveled,” with the vertical axis labeled “Number of Feet” and the horizontal axis labeled “Student Travelers.”

C.

Pie chart titled “Distance Traveled.”

D.

Line graph titled “Number of Feet Traveled.”

Questions # 19:

What is the result of 2/5 + 1/3 − 1/4?

Options:

A.

13/60

B.

11/60

C.

29/60

D.

19/60

Questions # 20:

The average lifespan of a dalmatian is 11.5 years, with a standard deviation of 1.5 years.

What are the two values between which 95% of the data falls for the average lifespan of a dalmatian, assuming a normal distribution?

Options:

A.

9.5 years and 13.5 years

B.

8.5 years and 14.5 years

C.

10.0 years and 13.0 years

D.

9.0 years and 14.0 years

Viewing page 2 out of 5 pages
Viewing questions 11-20 out of questions