
Summer Sale Limited Time 75% Discount Offer - Ends in 0d 00h 00m 00s - Coupon code = simple75

Pass the WGU Courses and Certificates Applied-Probability-and-Statistics Questions and answers with Dumpstech

Exam Applied-Probability-and-Statistics Premium Access

View all detail and faqs for the Applied-Probability-and-Statistics exam

Practice at least 50% of the questions to maximize your chances of passing.
Viewing page 3 out of 5 pages
Viewing questions 21-30 out of questions
Questions # 21:

Dataset: 3, 5, 7, 9, 11. Median = ?

Options:

A.

7

B.

5

C.

9

D.

6

Questions # 22:

In a normal distribution, 95% of data lies within:

Options:

A.

±2 SD

B.

±1 SD

C.

±3 SD

D.

±4 SD

Questions # 23:

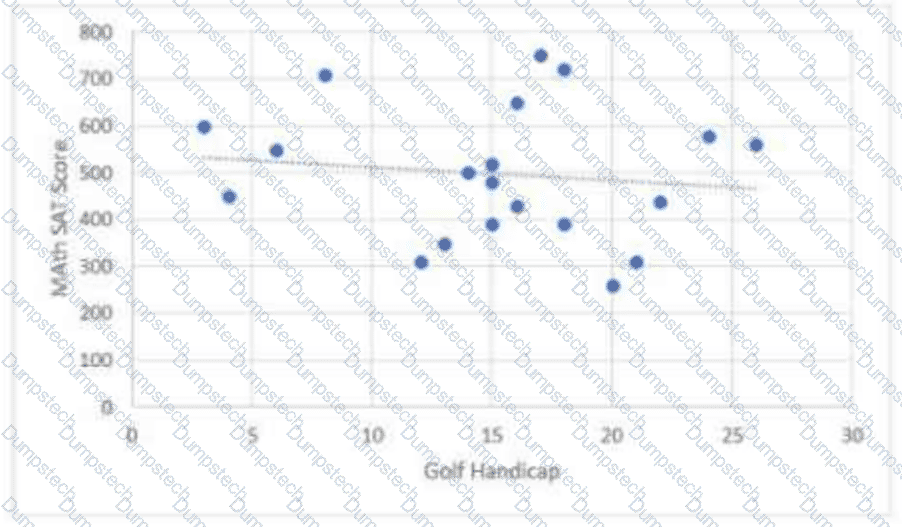
A golf course is attempting to correlate golfing handicap with math SAT scores among local high school golfers. Ignoring potential confounding variables such as socioeconomic status, the golf course creates the following scatterplot.
Question # 23

What is the estimated value of r, the correlation coefficient, between these variables?

Options:

A.

−0.63

B.

−0.10

C.

0.10

D.

0.63

Questions # 24:

A university surveys faculty and students to determine support for a new campus recycling initiative.

The results of the survey are shown in the following 2 × 2 contingency table:

Question # 24

Which statement is true?

Options:

A.

Faculty members are slightly more likely than students to support the recycling initiative.

B.

Faculty members are much more likely than students to support the recycling initiative.

C.

Faculty members are slightly less likely than students to support the recycling initiative.

D.

Faculty members are much less likely than students to support the recycling initiative.

Questions # 25:

A biologist is studying the relationship between plant species, species A, species B, and species C, and the average height of the plants.

How should this study be classified?

Options:

A.

Categorical→categorical

B.

Categorical→quantitative

C.

Quantitative→quantitative

D.

Quantitative→categorical

Questions # 26:

What percent of data lies within 2 standard deviations of the mean in a normal distribution?

Options:

A.

95%

B.

68%

C.

99%

D.

50%

Questions # 27:

Binomial distribution parameters = ?

Options:

A.

n, trials; p, success probability

B.

λ

C.

μ and σ

D.

None

Questions # 28:

Sum of probabilities in sample space = ?

Options:

A.

1

B.

0

C.

> 1

D.

Cannot exceed 2

Questions # 29:

A researcher has collected information on students from a school. The researcher wants to display the ethnic groups represented in the school.

Which pair of graphs both display data in this manner?

Options:

A.

Pie chart and box plot

B.

Bar graph and pie chart

C.

Line graph and bar graph

D.

Bar graph and histogram

Questions # 30:

Independent events: P(A|B) = ?

Options:

A.

P(A)

B.

P(B)

C.

0

D.

P(A) + P(B)

Viewing page 3 out of 5 pages
Viewing questions 21-30 out of questions