
Pre-Winter Sale Limited Time 75% Discount Offer - Ends in 0d 00h 00m 00s - Coupon code = simple75
Pass the Salesforce Tableau Data Analyst Analytics-DA-201 Questions and answers with Dumpstech
You plan to create a Tableau subscription for several users.
Which two formats can you use? Choose two.
You create a parameter named Choose Region fiat contains values from a field named Region.
You want users to be able to use the Choose Region parameter to interact with a chart by logging between different regions
What should you do next?
A Data Analyst needs to develop a Sales Dashboard that users can access through a computer or by phone and tablet using the same URL link.
How should the analyst create dashboards that are formatted for specific devices?
You are creating an annual report in Microsoft Word.
In Tableau Desktop, you build a chart in a worksheet.
You want to create an image of the chart that you can add to the annual report.
What are two ways to create the image? Choose two.
A Data Analyst has a data source that contains the following columns:
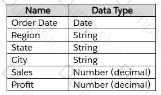
he analyst has the following FIXED Level of Detail (LOD) expression called Region Sales:
{ FIXED [Region] : SUM([Sales] ) }
The analyst has a view that has a dimension filter on the State column to exclude five states.
What should the analyst do to ensure the five states are also excluded from the LOD expression?
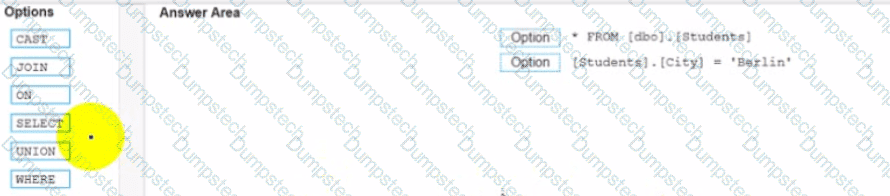
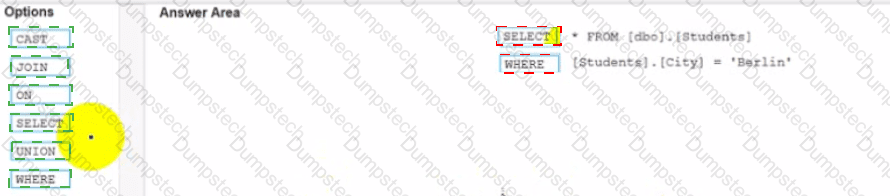
You conned to a Microsoft SQL Server database
You need to create a custom SQL query that retrieves rows from a table named Students Only students m the city of Berlin must be returned
How should you complete the query? (Drag the appropriate Options to the Answer Area and drop into the correct locations.)
When should a Data Analyst use a Treemap in Tableau?
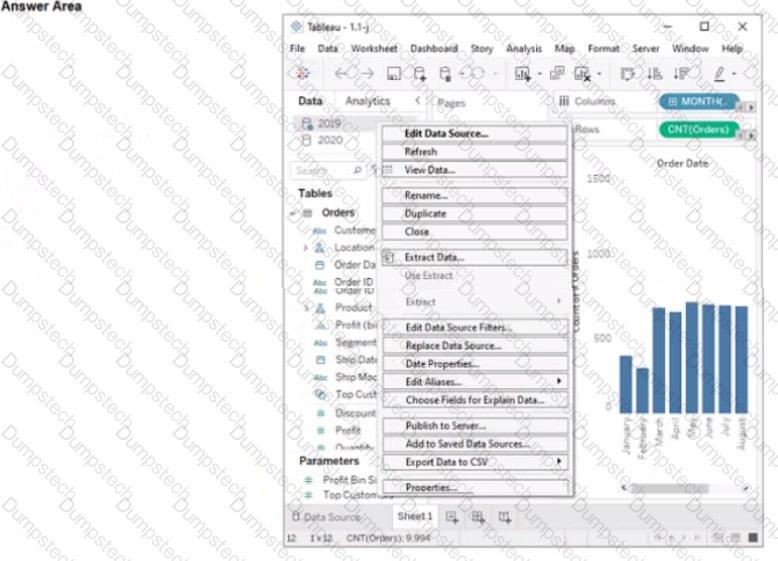
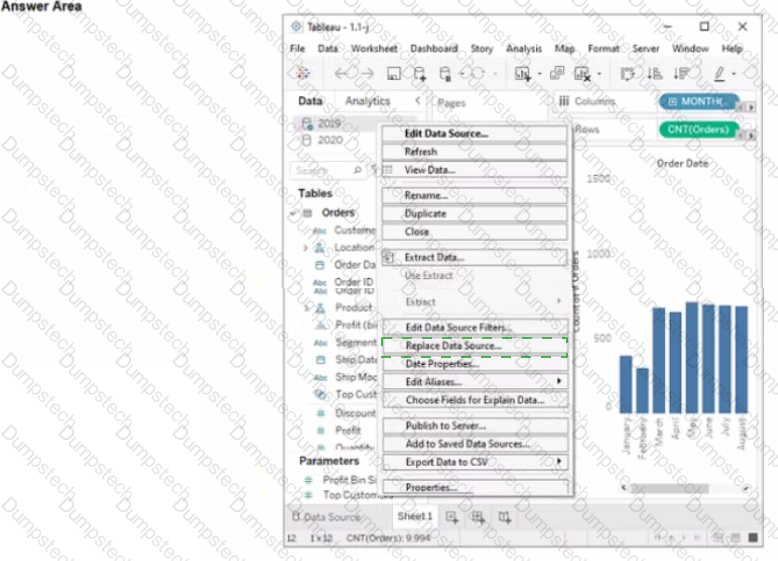
You have two data sources that use the same schema One data source contains order data from 2019 and the other data source contains order data from 2020.
You have a worksheet that shows the orders from 2019.
You need to configure the worksheet to show the orders from 2020 without reloading the data.
Which option should you select?
You have the following dataset.
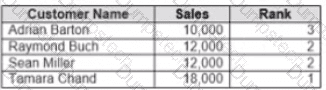
Yon need to calculate the ranking shown in the Rank field.
How should you complete the formula? (Use the dropdowns in the Answer Area to select the correct options to complete the formula ?


You have the following line chart that shows the average sales by month.
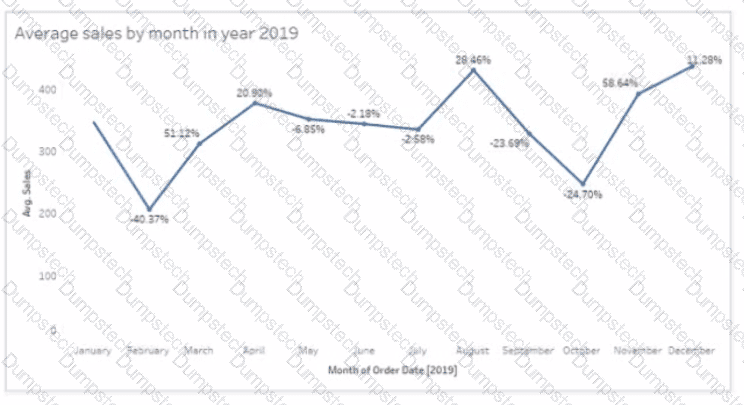
Which month had the biggest increase in swage sales compared to me previous month in 2019?
