
Pre-Winter Sale Limited Time 75% Discount Offer - Ends in 0d 00h 00m 00s - Coupon code = simple75
Pass the Salesforce Tableau Data Analyst Analytics-DA-201 Questions and answers with Dumpstech
Which attributes are required for the field that is used to hide or show an object with Dynamic Zone Visibility?
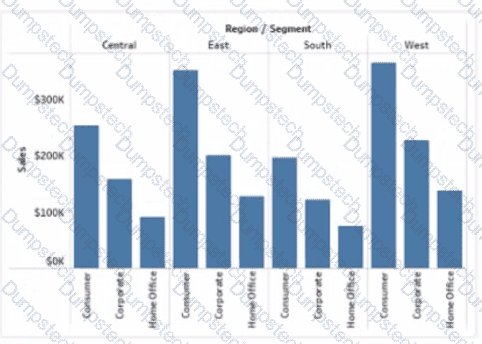
You have the following bar chart.
You want the chart to appear as shown in the Mowing exhibit.
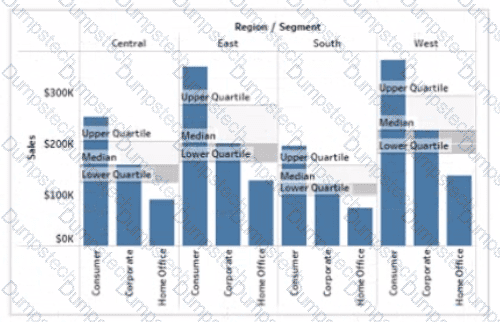
What should you add?
When using the INCLUDE Level of Detail (LOD) calculation, where should the dimension referenced by the INCLUDE function be located on the sheet?
You are developing a data source in Tableau Prep.
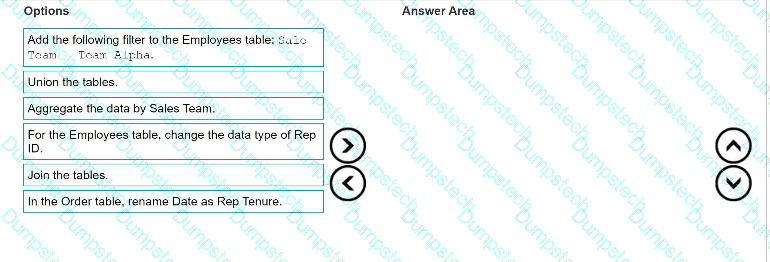
You have two tables named Orders and Employees.
The Orders table was created in 2019 and contains the following columns.

The Employees table contains all the employee information for the various sales teams in the sales department and contains the following columns

You want to prepare the data so that you can analyze sales trends over time for every sales team.
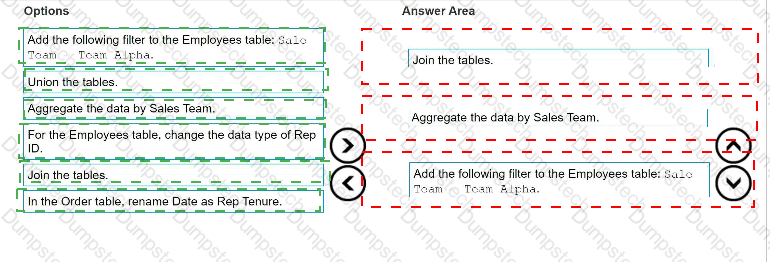
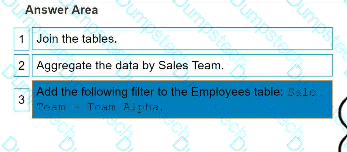
Which three actions should you perform in order? (Place the three correct options in order. Use the arrows to move Options to Answer Area. Use Answer Area arrows to re-order the options.)
You have the following:
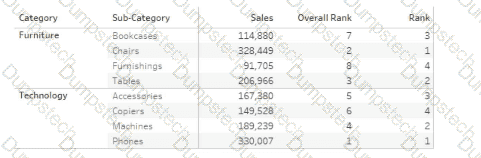
Overall Rank and Rank are calculated fields that use the RANK function.
You filter out the sub-category where [Ovorall Rank] - 1.
For which three the sub-categories will the value of Rank change? Choose three.
You want to add a comment to March 2020 as shown in the following visualization.
You have the following sets in a Tableau workbook
• Top N Customers
• Customers of 2020
• Top N Products
• Sellers of 2020
Which two sets can you combine? Choose two
From Tableau Desktop, a Data Analyst signs in to a site within Tableau Server.
What appears in the list of available data sources when the analyst searches for a published data source?
in which three formats can you export a worksheet from the Worksheet menu? Choose three
When should a Data Analyst use a Treemap in Tableau?
A Data Analyst has the following chart that shows the sum of sales made in different cities.
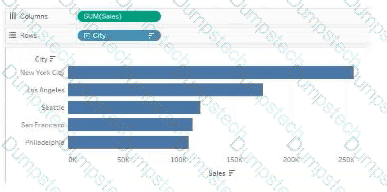
The analyst wants to show the average sale amount for a city when users hover their mouse over any of the bars.
What should the analyst do?
