
Pre-Winter Sale Limited Time 75% Discount Offer - Ends in 0d 00h 00m 00s - Coupon code = simple75
Pass the Salesforce Tableau Data Analyst Analytics-DA-201 Questions and answers with Dumpstech
You have the following dashboard that contains two visualizations.
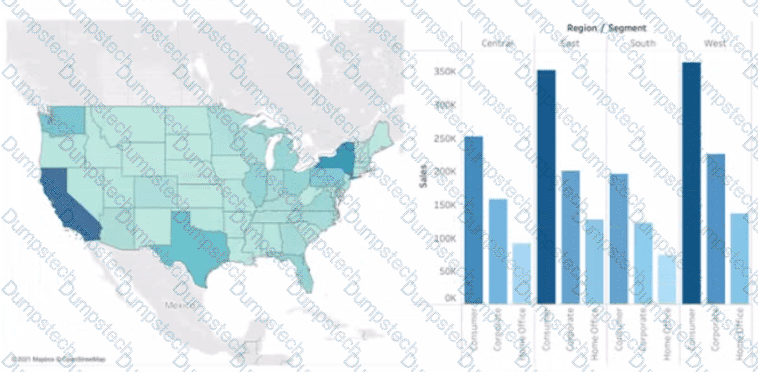
You want to show only one visualization at time. Users must be able to switch between visualizations.
What should you me?
You have a database that includes field named sales, City and Region.
You have the following chart that shows the number of sales made in different cities.
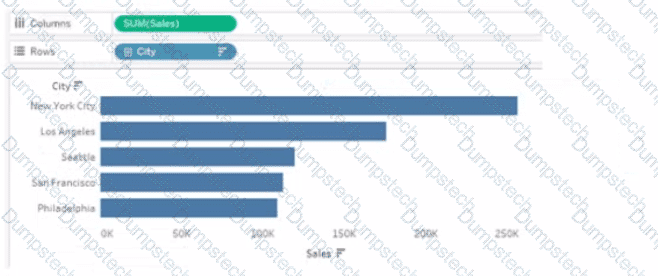
You want to dynamically show the corresponding region when users hover their mouse over any of the bars.
What should you do?
You have the following tiled dashboard that has one sheet.
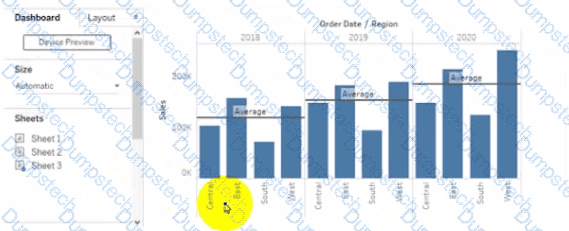
You want to replace the sheet with Sheet2.
What should you do?
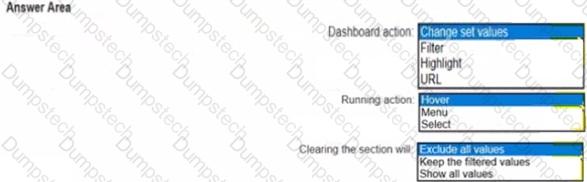
You have the following dashboard.
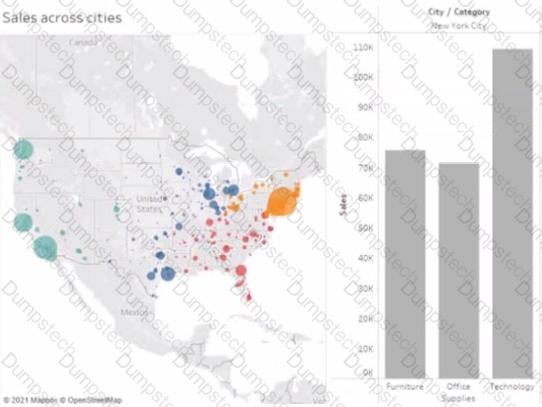
When a user selects a only on the map the data on the bar chart must show only the data for the selected city. The data in the bar chart must change only when the user selects a different city How should you configure the dashboard action? (Use the dropdowns in the Answers Area to select the correct options.)

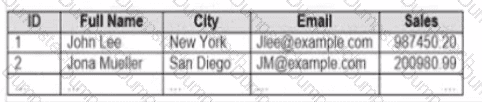
You company has two divisions located in the United States and Germany Bach division has a separate database. The following is a sample of the sales data for the division in the United States.
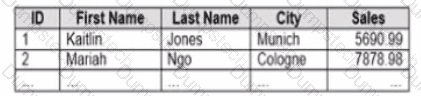
The following is a sample of the sales data for me division in Germany.
You have population data in a file named Populatio.csv. the following is a sample of the data.
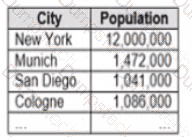
You plan to create a visualization that ml show tie sales per capita for each salesperson Each salesperson must be identified by identified by their full name.
You need to prepare the data to support the planned visualization. The data source must support being published .
Which four actions should you perform in order?
(Place the four correct options n order Use the arrows to move Options to Answer Area arrows to re-order the options.
Use Answer Area arrows to re-order the options)


You have the following box plot that shows the distribution of average profits made in every state by region.
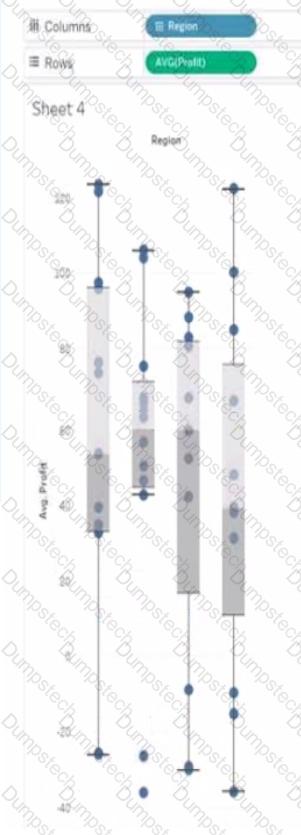
Which region has the smallest distribution of profits?
When using a Show/Hide button in Tableau, what happens if the object is in a Tiled layout container?
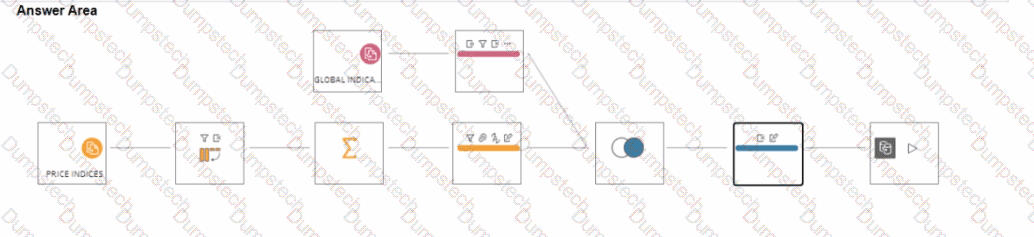
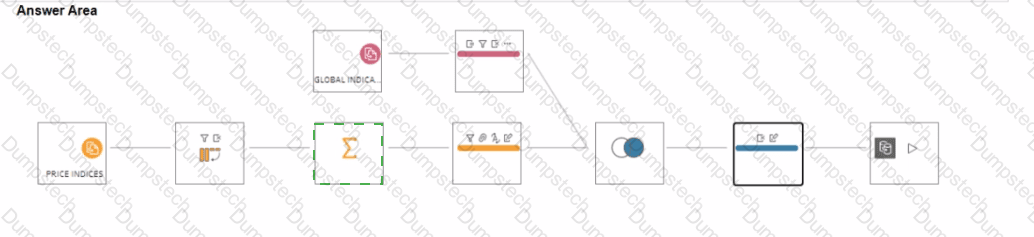
You have a Tableau Prep flow that joins a dataset named Global Indicators to a dataset named Price Indices.
In which step can you transform rows of monthly data into rows of yearly data ' '
You have two tables named Employeelnfo and DepartmentInfo. Employeelnfo contains four fields named Full Name, Department ID, Start Date, and Salary.
DepartmentInfo contains four fields named Department Name, Size, Department ID, and VP.
You want to combine the tables to meet the following requirements:
. Each record in Employeelnfo must be retained in the combined table.
. The records must contain the Department Name, Size, and VP fields.
· Every record must have a full name.
Which type of join should you use?
You want to show the cumulative total of each year for every state.
Which quick table calculation should you use?
