
Summer Sale Limited Time 75% Discount Offer - Ends in 0d 00h 00m 00s - Coupon code = simple75
Pass the WGU Courses and Certificates Applied-Algebra Questions and answers with Dumpstech
The number of property sales in a region this year is expected to be 8 times the number of property sales in the region last year. The function H(x)represents the number of property sales this year, where xrepresents the number of properties sold last year.
Which notation represents the number of property sales this year, given that the number of properties sold last year was 360?
The function P(t)represents the daily profit, in hundreds of dollars, for a hardware store since opening. The graph of P(t)is shown.
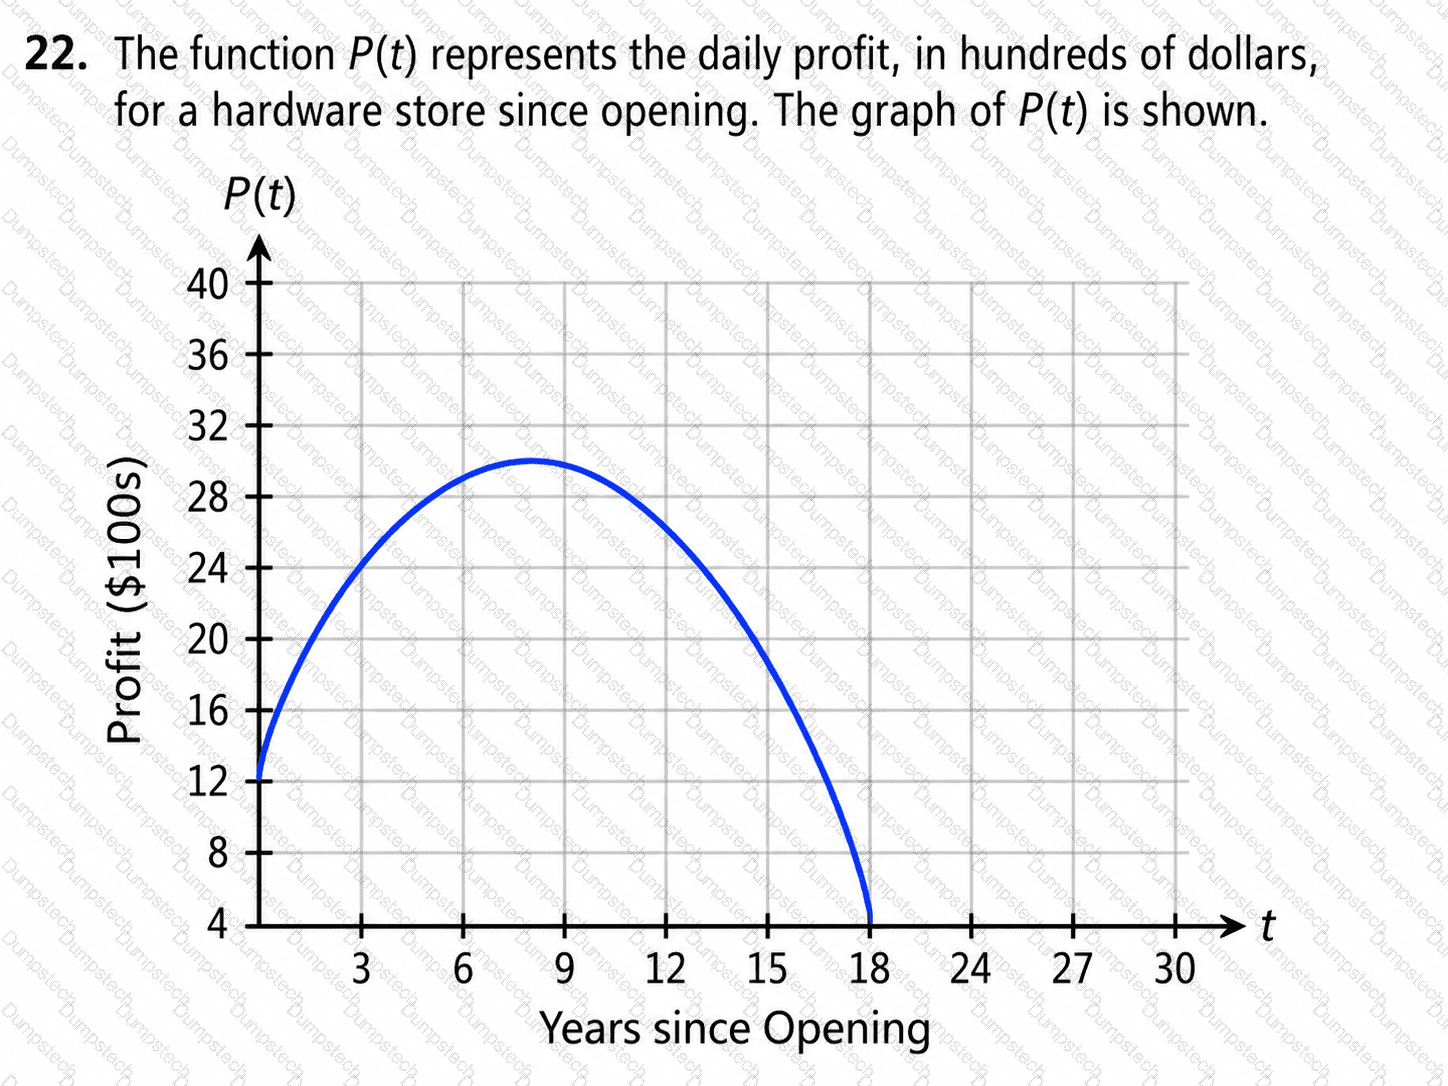
How should the maximum value be interpreted?
The value of a collectible artifact is represented by the function
f(x)=330× 〖 1.15 〗 ^x
In this function, xrepresents the number of years since 2005, and f(x)represents the value of the artifact, in dollars.
Which value represents the average yearly rate of change of the value of the artifact from 2006 to 2011?
A factory mixes two colors, red and yellow, to create a dye.
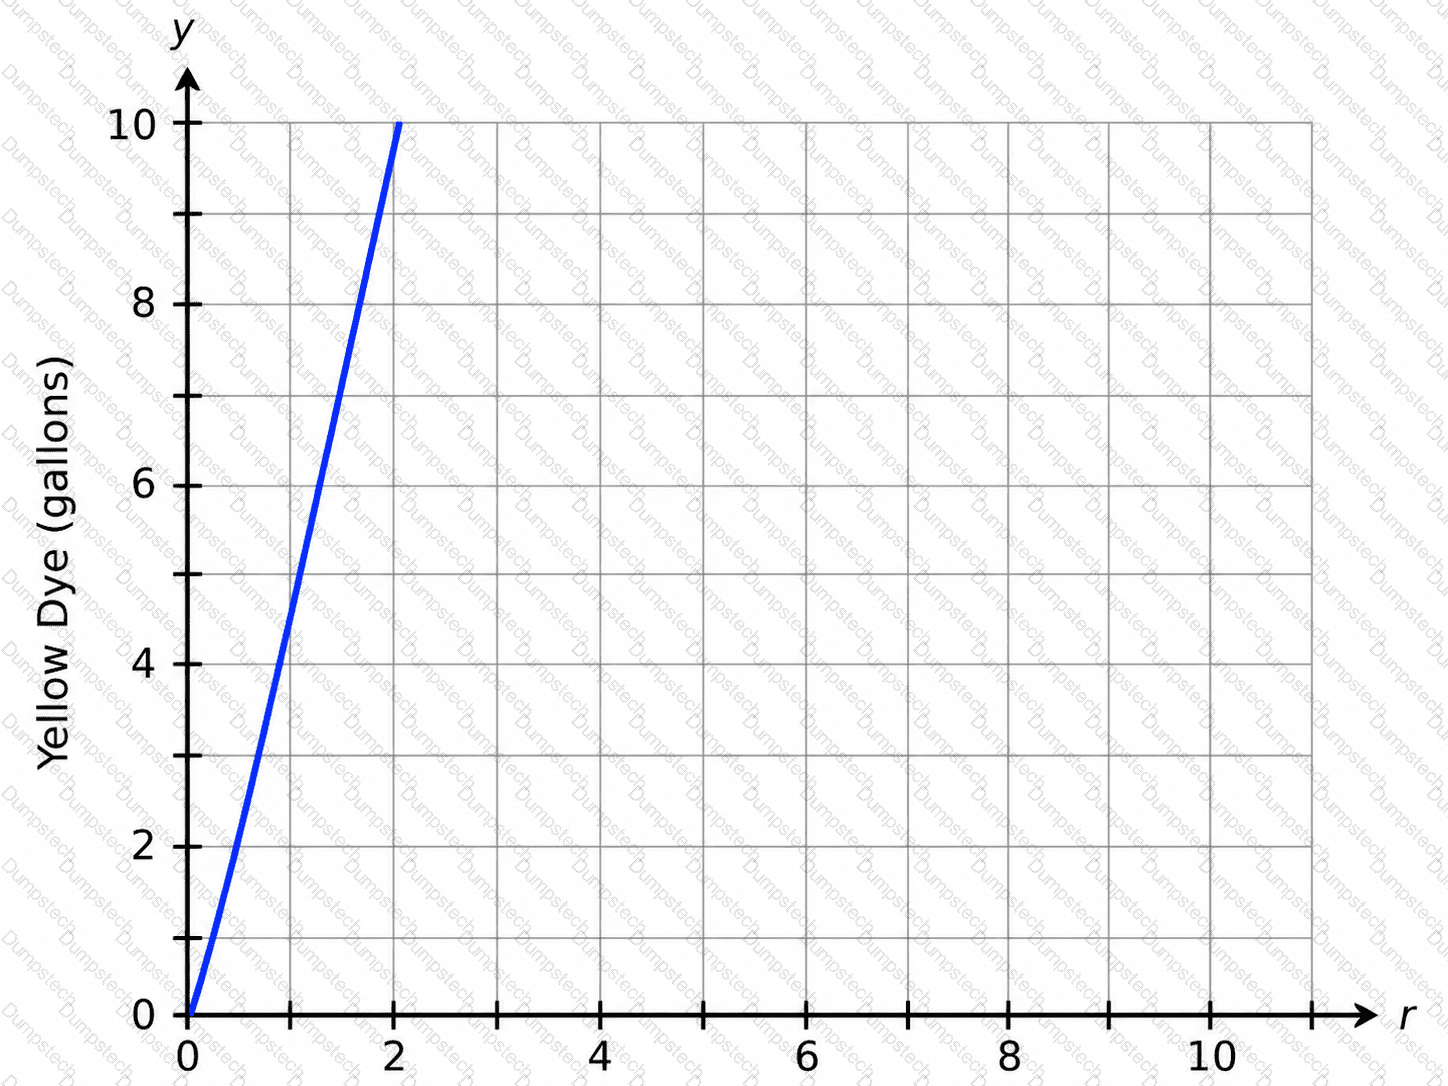
The graph shows the relationship between the amounts of each dye, where rrepresents the amount of red dye and yrepresents the amount of yellow dye.
What is the correct interpretation of the rate of change?
The number of people auditioning for a game show is expected to be 4 times the number of people who auditioned last year. The function A(t) can be used to model the situation, where t represents the number of people who auditioned last year and A represents the number of people expected to audition this year.
Which quantity represents the number of people expected to audition this year, given that 330 people auditioned last year?
The spread of two viruses within a single population is modeled using the functions in the graph.
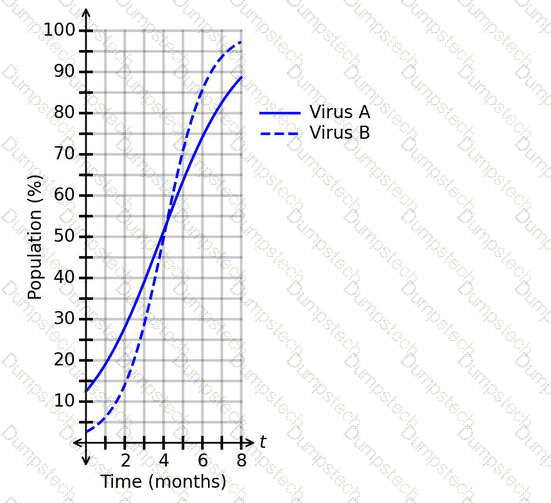
What is a correct conclusion based on the graph?
Consider the function
w(t)=0.03t^4-0.81t^3+7.55t^2-26.62t+44
which represents the number of workers, w, at a job site thours after 6:00 a.m.
What is the difference between w(4)and w(8)?
The given function represents the price of a commodity, p, in dollars, based on the number of months, m, since the beginning of 2020.
p(m)=5m+5
What is the average rate of change of the price over the interval m=1to m=10?
A researcher collected data on the number of annual bear sightings in a region over time. The results are shown in the scatterplot. A regression function is graphed with r^2=0.42. The predicted number of annual bear sightings after 19.5years is 62.2.
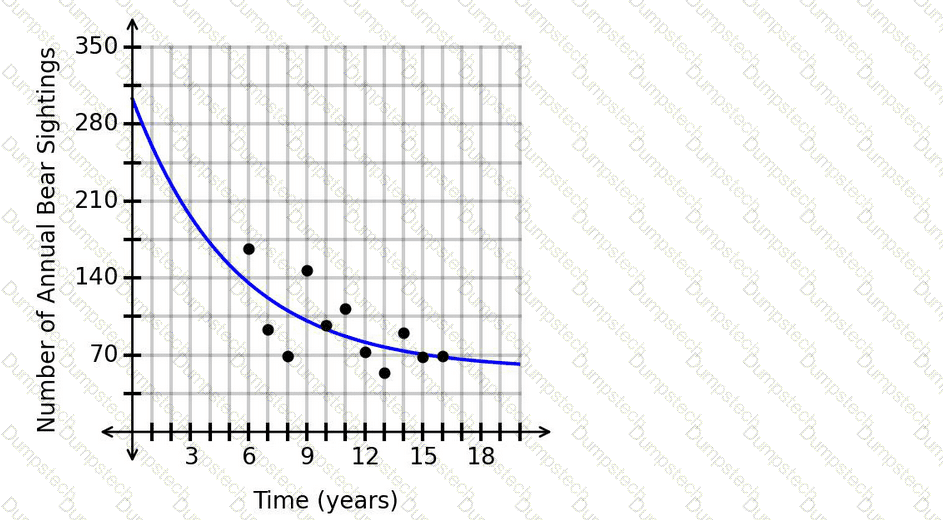
Is this prediction appropriate?
The function f(n) represents the relationship between the distances traveled by two vehicles, where n is the distance traveled by vehicle A and f is the distance traveled by vehicle B. The distance traveled by vehicle B is 17 more than the distance traveled by vehicle A.
Which function represents this situation?