
75only - Ends in 0d 00h 00m 00s - Coupon code = 75only
Pass the WGU Courses and Certificates Applied-Algebra Questions and answers with Dumpstech
A researcher collected data on the number of annual bear sightings in a region over time. The results are shown in the scatterplot. The graphed regression function has an r
2
value of 0.41. The predicted number of annual bear sightings after 19.4 years is 88.5.
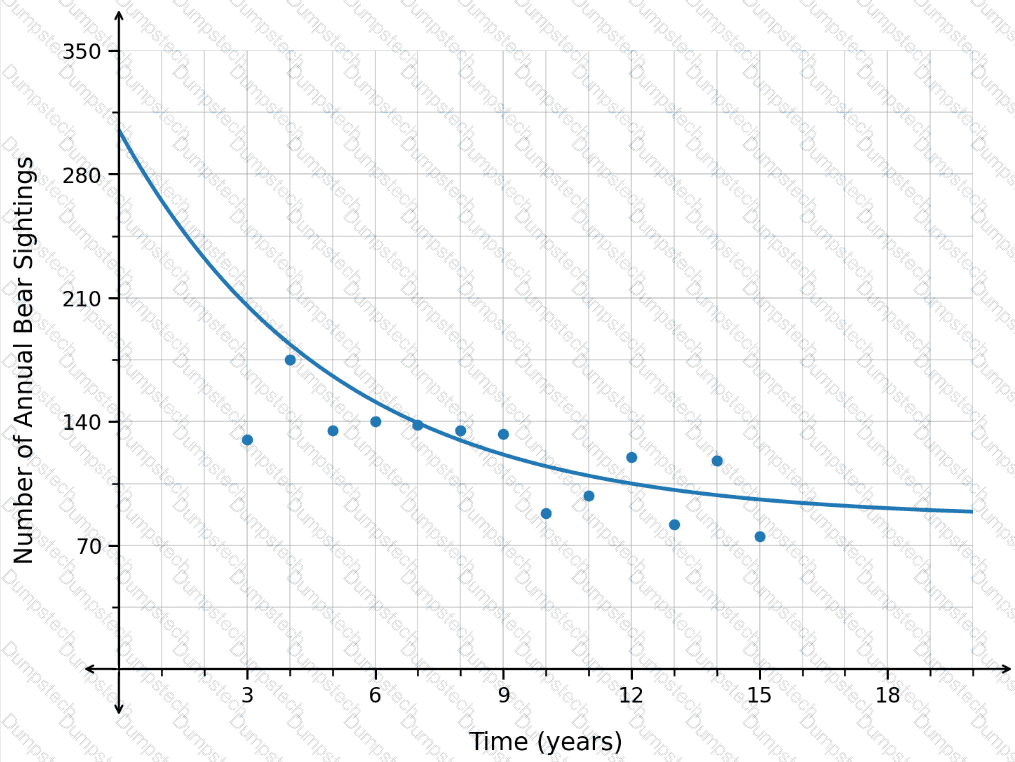
Is this prediction appropriate?
A researcher collected data on the number of large donations per year to a charitable organization. The results are shown in the scatterplot. A regression function is graphed with r^2.
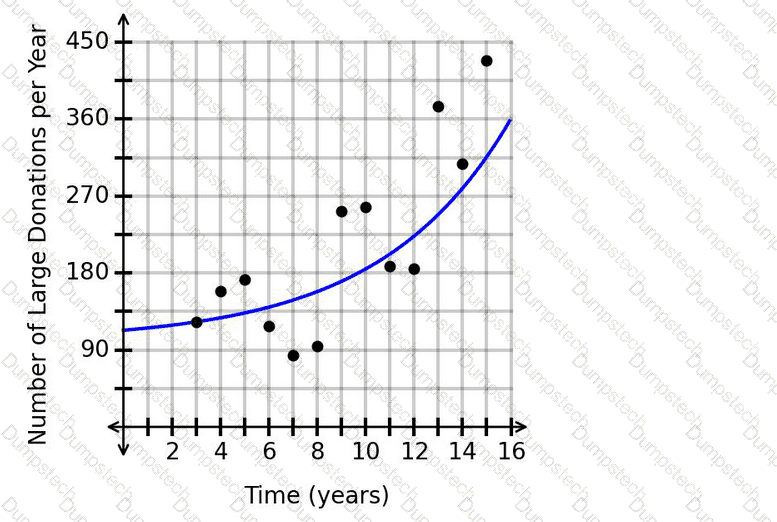
What is the appropriate range of x-values for extrapolation?
The populations, in thousands, of two towns are shown in the graph, where the horizontal axis measures the time in years.
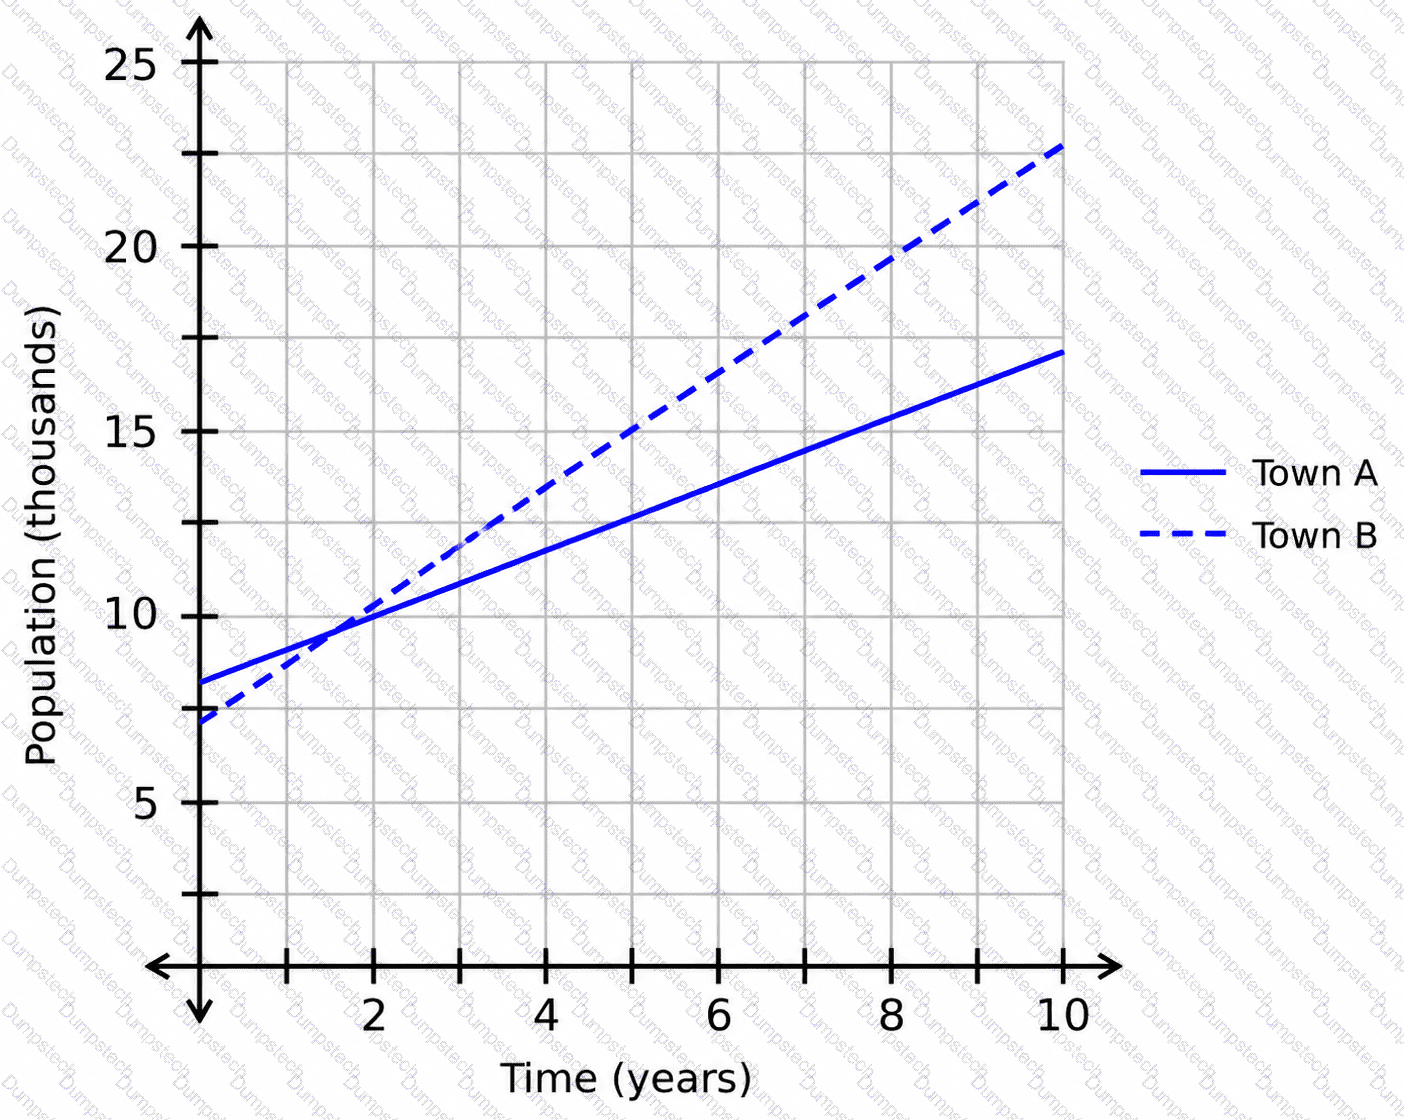
Which town’s population is growing at a faster rate?
The number of wild horses in a federal park is represented by the logistic function f(x), whose graph is shown, where xrepresents the number of years since the park was established and f(x)represents the wild horse population in a given year.
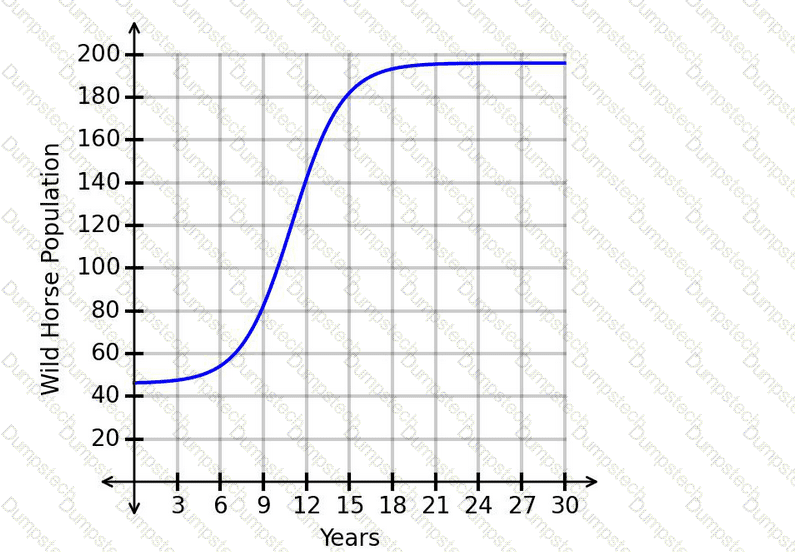
How does the number of wild horses change as time progresses from year 1 to year 9?
The graphed function v(t) represents the number of vehicles, v, stopped at a toll booth t hours after 6:00 a.m. The coordinates of points A and B are (1,49.4) and (4,45.8), respectively.
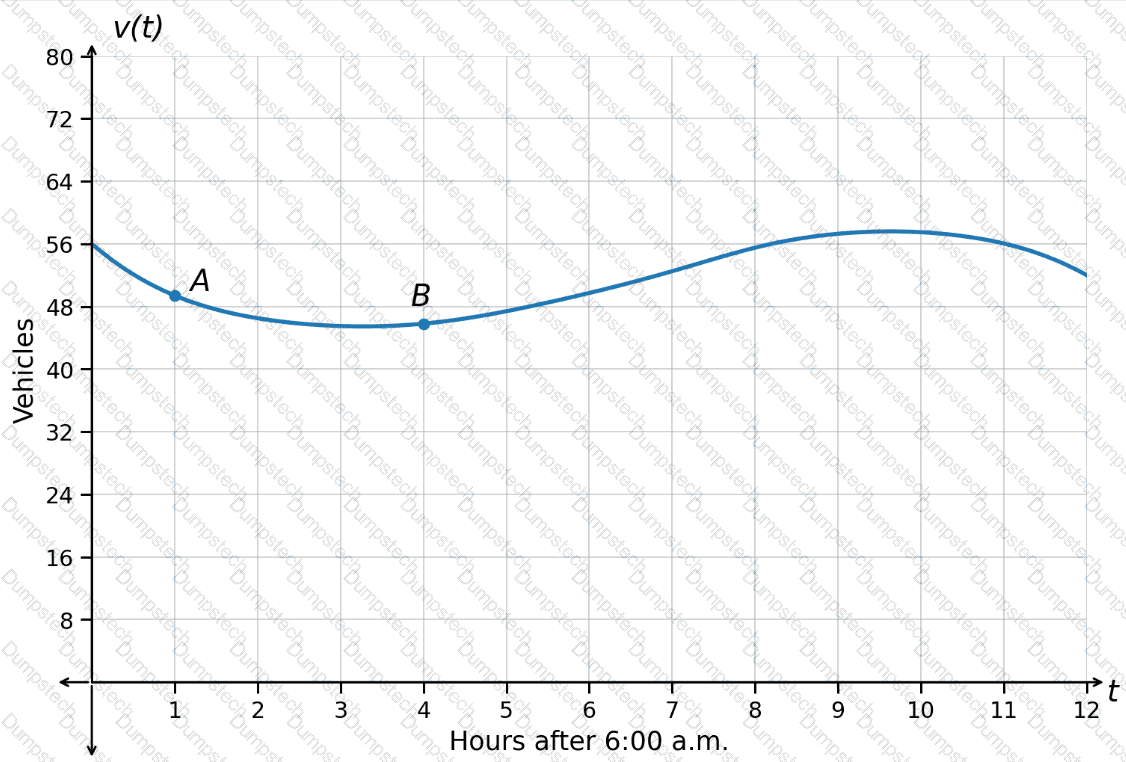
What is the average rate of change of the number of vehicles from point A to point B?
The number of property sales in a region this year is expected to be 8 times the number of property sales in the region last year. The function H(x)represents the number of property sales this year, where xrepresents the number of properties sold last year.
Which notation represents the number of property sales this year, given that the number of properties sold last year was 360?
The population of fish in a lake is changing according to the function
P(t)=24t+185
where tis the number of months since the beginning of the year and P(t)is the fish population at time t.
Which interpretation of the rate of change is correct?
The number of acres affected by an invasive species can be modeled using the logistic function f(x), where xrepresents the number of months since the species was introduced and f(x)represents the number of affected acres. The graph of f(x)is shown.
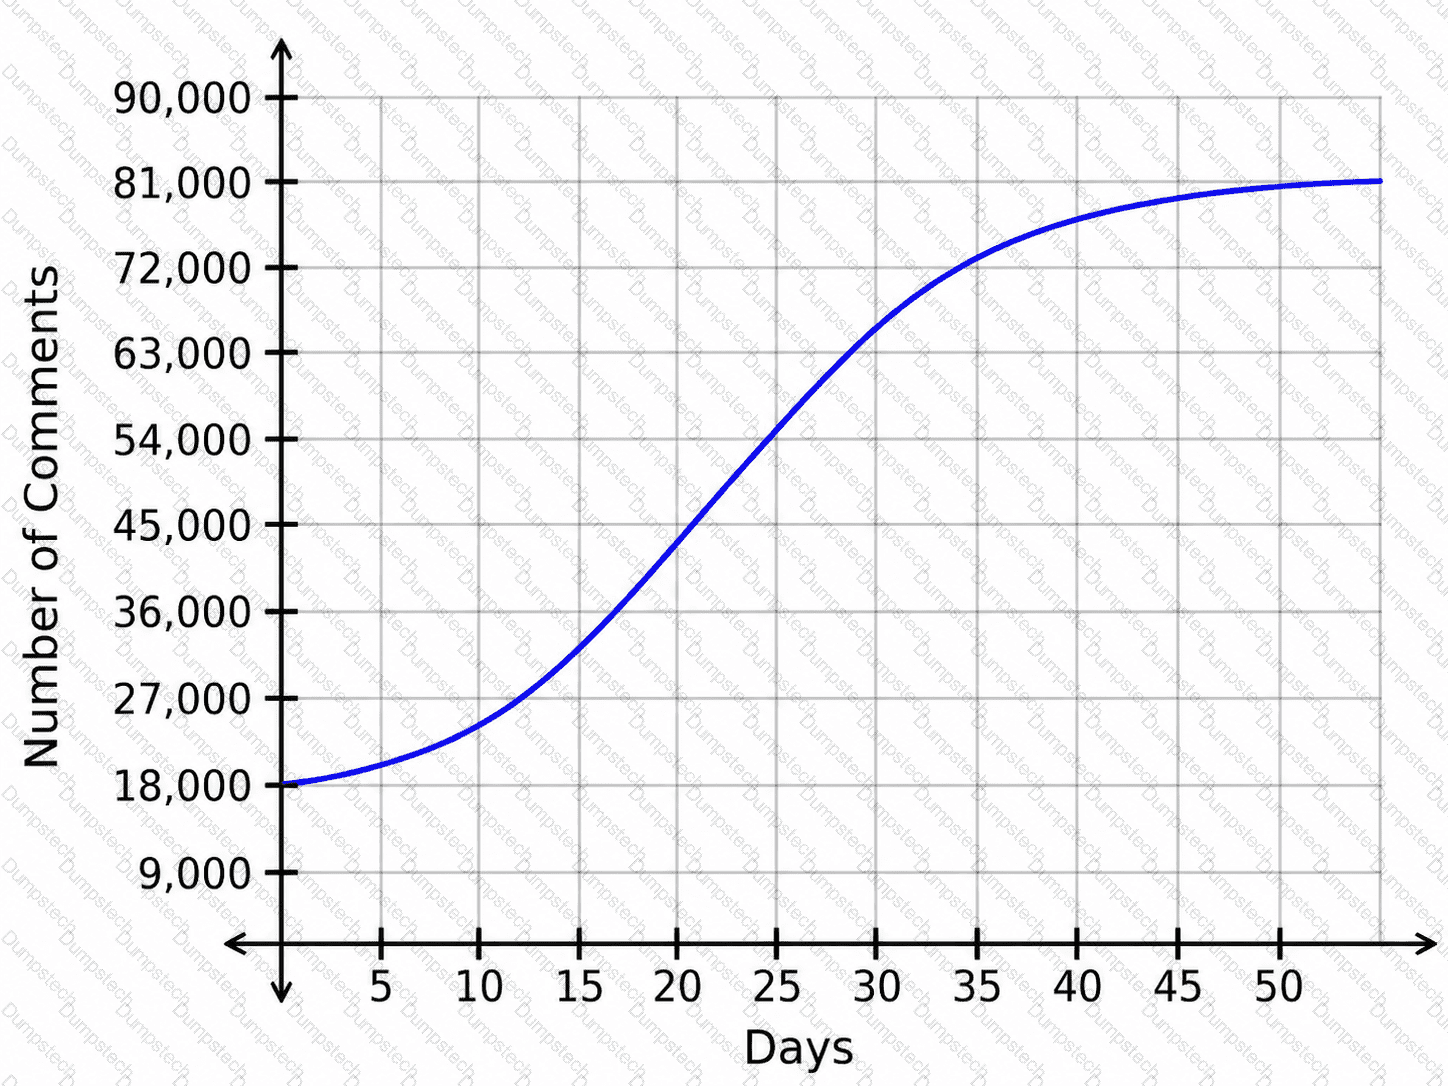
What happens as time progresses from month 2 to month 6?
The function f(n) represents the relationship between the distances traveled by two vehicles, where n is the distance traveled by vehicle A and f is the distance traveled by vehicle B. The distance traveled by vehicle B is 17 more than the distance traveled by vehicle A.
Which function represents this situation?
Consider the function I(m)=41m²−490m+30, which represents the daily income, I, in dollars, of a store based on the number of months, m, since the beginning of the year. What is the difference between I(7) and I(9)?
