
Summer Sale Limited Time 75% Discount Offer - Ends in 0d 00h 00m 00s - Coupon code = simple75
Pass the WGU Courses and Certificates Applied-Algebra Questions and answers with Dumpstech
The temperature of an object changes according to the relationship in the graph.
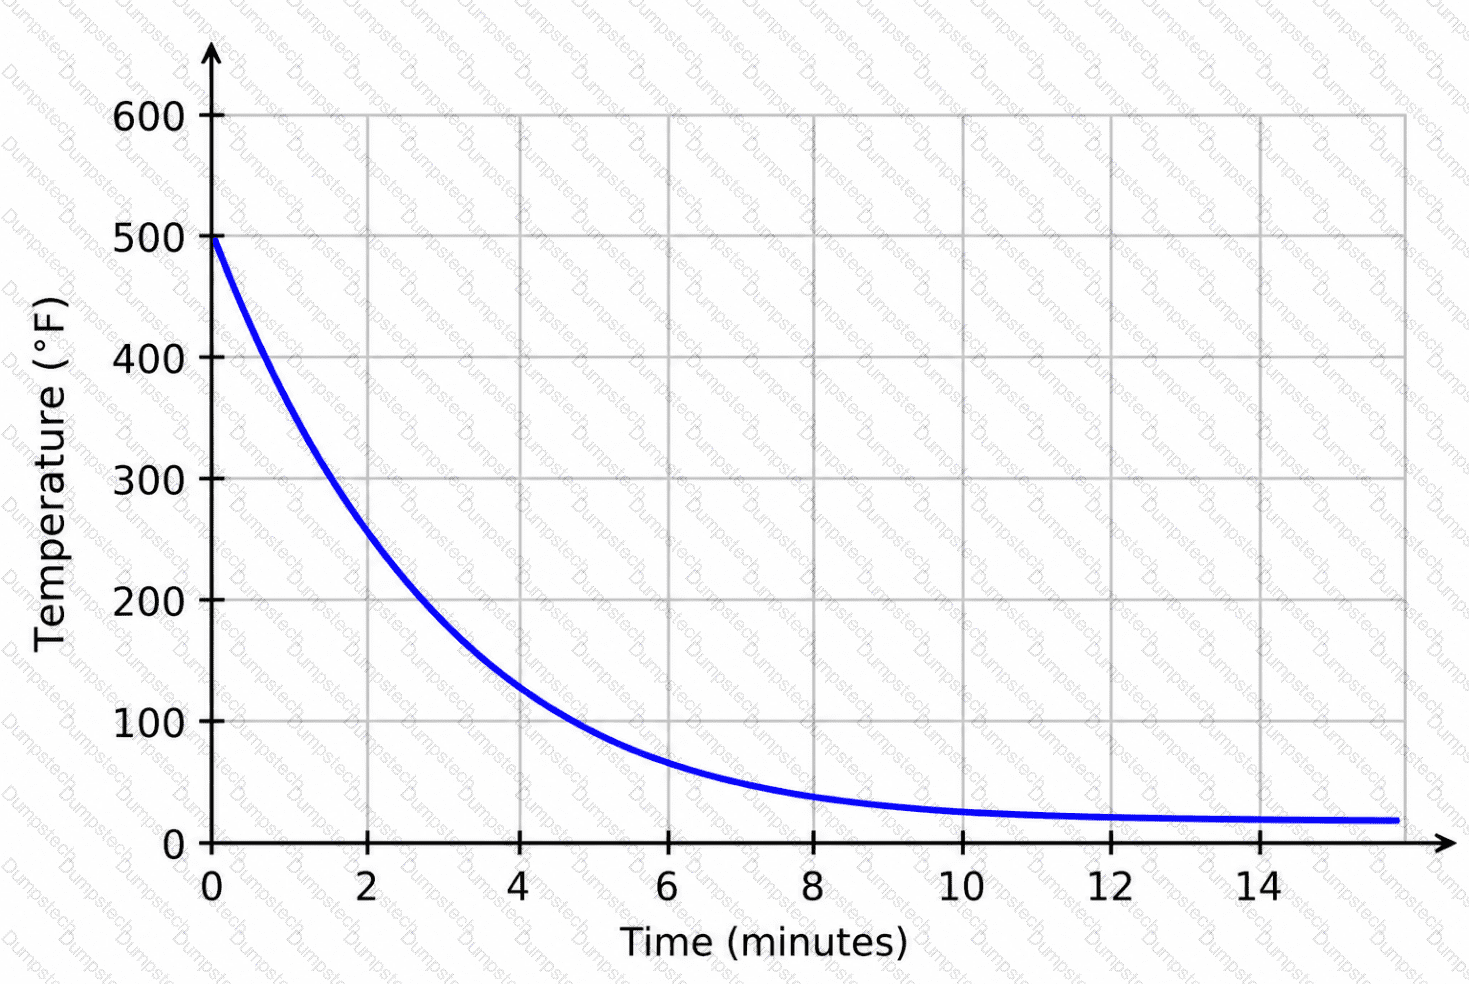
Which equation represents the horizontal asymptote of the function?
A researcher collected data on the number of members in a national association over time. The results are shown in the scatterplot. The graphed regression function has an r^2value of 0.54.
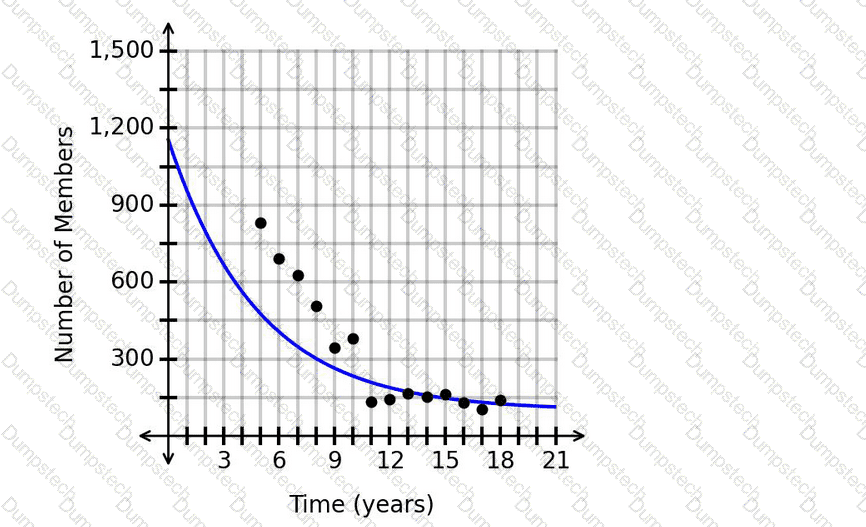
Is it appropriate to make a prediction for the number of members after 20.6years?
The graph shows the total cost of a lumber delivery based on the number of identical boards ordered.
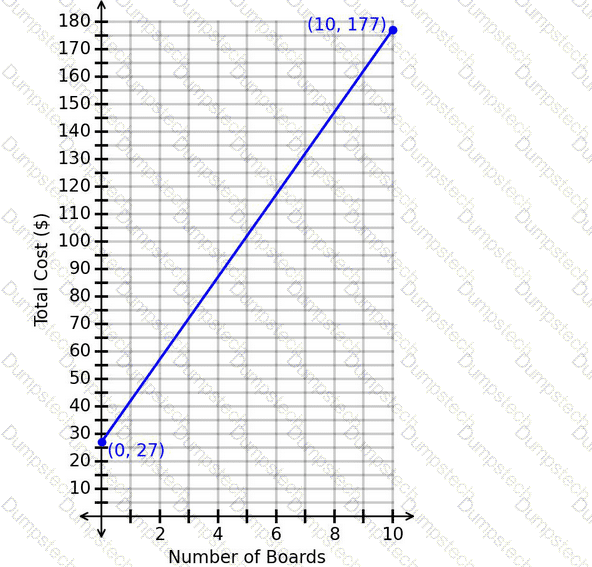
What is the cost of each additional board?
The logistic function f(x), whose graph is shown, models the number of registrants for an academic conference, where xrepresents the number of weeks since registration opened and f(x)represents the number of registrants.
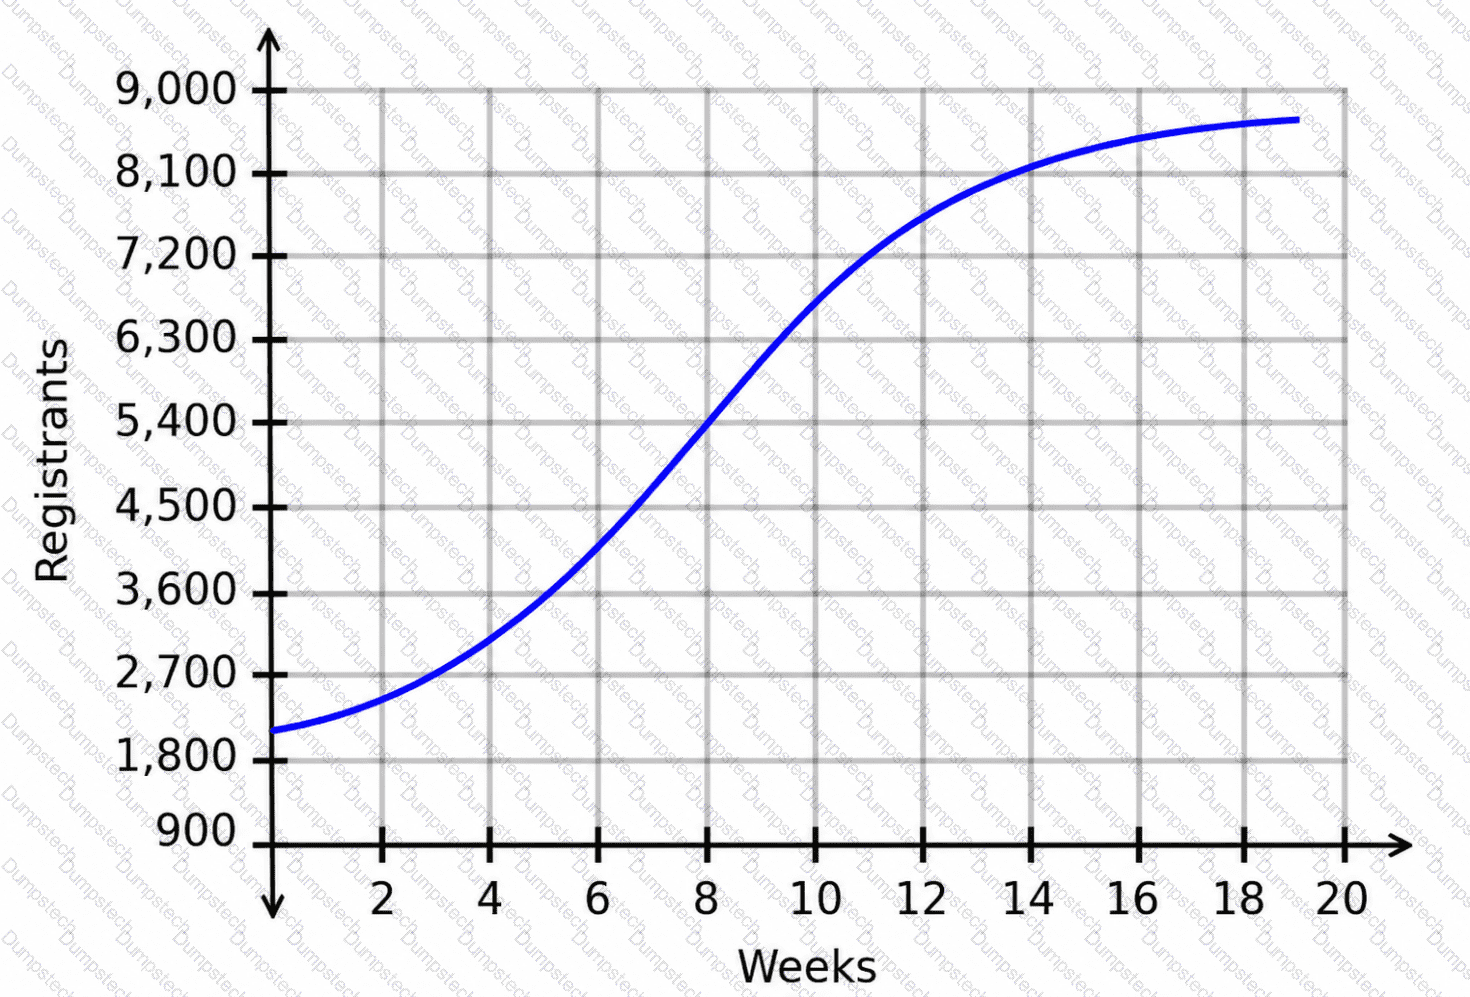
How does the number of registrants change as time progresses from week 1 to week 7?
The graph shows the weekly profit in hundreds of dollars for a coffee shop. The horizontal axis represents the number of years since the coffee shop opened.
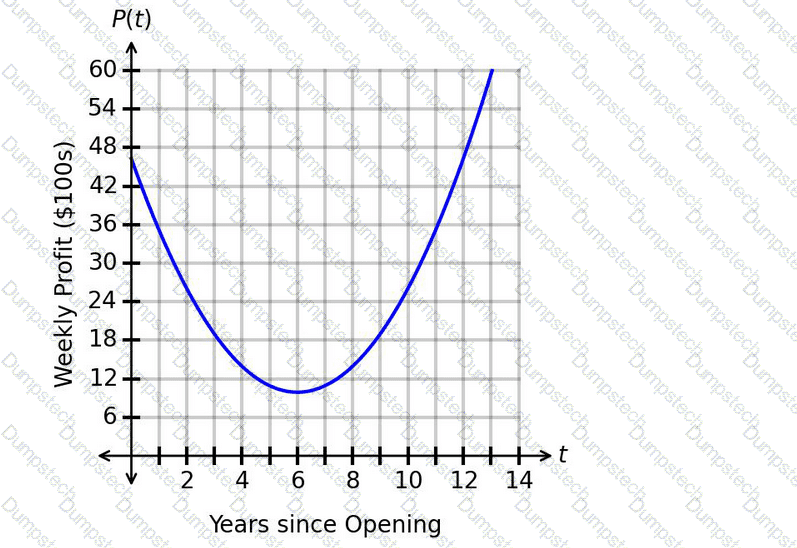
What is the correct interpretation of the minimum value?
A recipe calls for a constant ratio of water and lemon juice. The graph shows the relationship between the amounts of these two ingredients, where wis the volume of water and lis the volume of lemon juice.
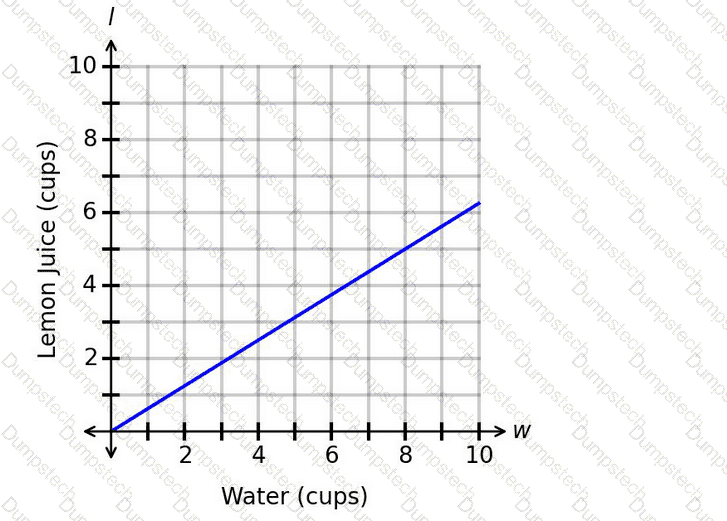
What is the correct interpretation of the rate of change?
The figure shows the graph of p(t), which represents the number of people, p, at a gym thours after 7:00 a.m.
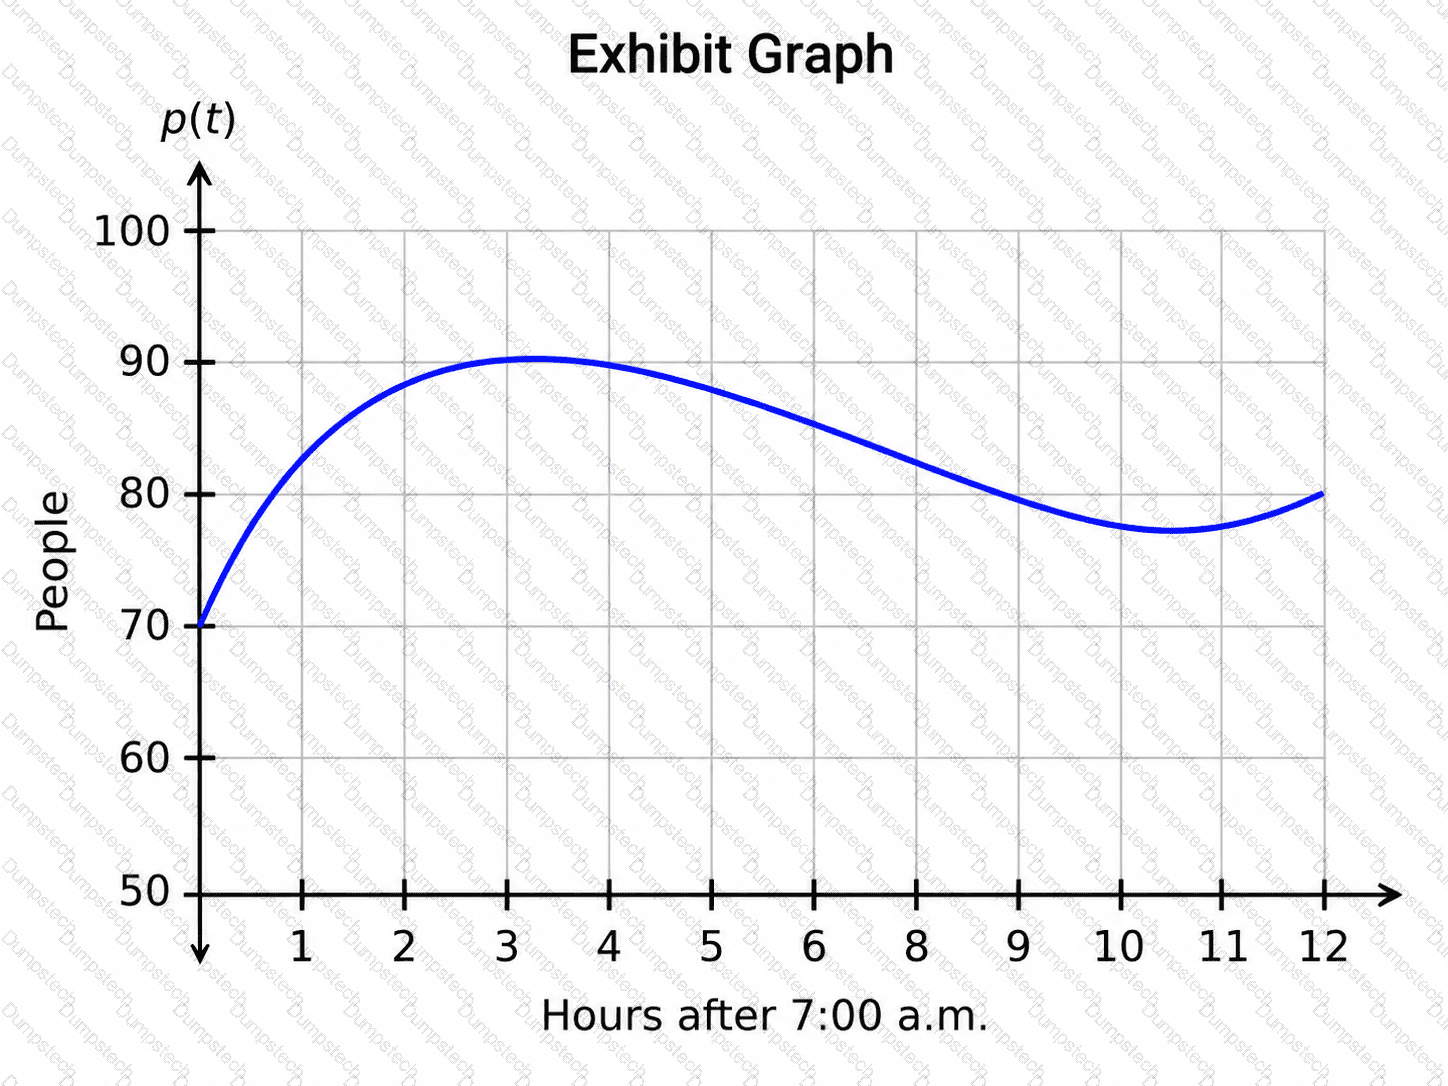
How should the concavity between t=1.3and t=3.4be interpreted?
Based on collected data, the number of registered voters in a district can be modeled using the function
f(x)=1,300× 〖 0.92 〗 ^x
whose graph is shown, where xrepresents the number of years since 2001 and f(x)represents the number of registered voters.
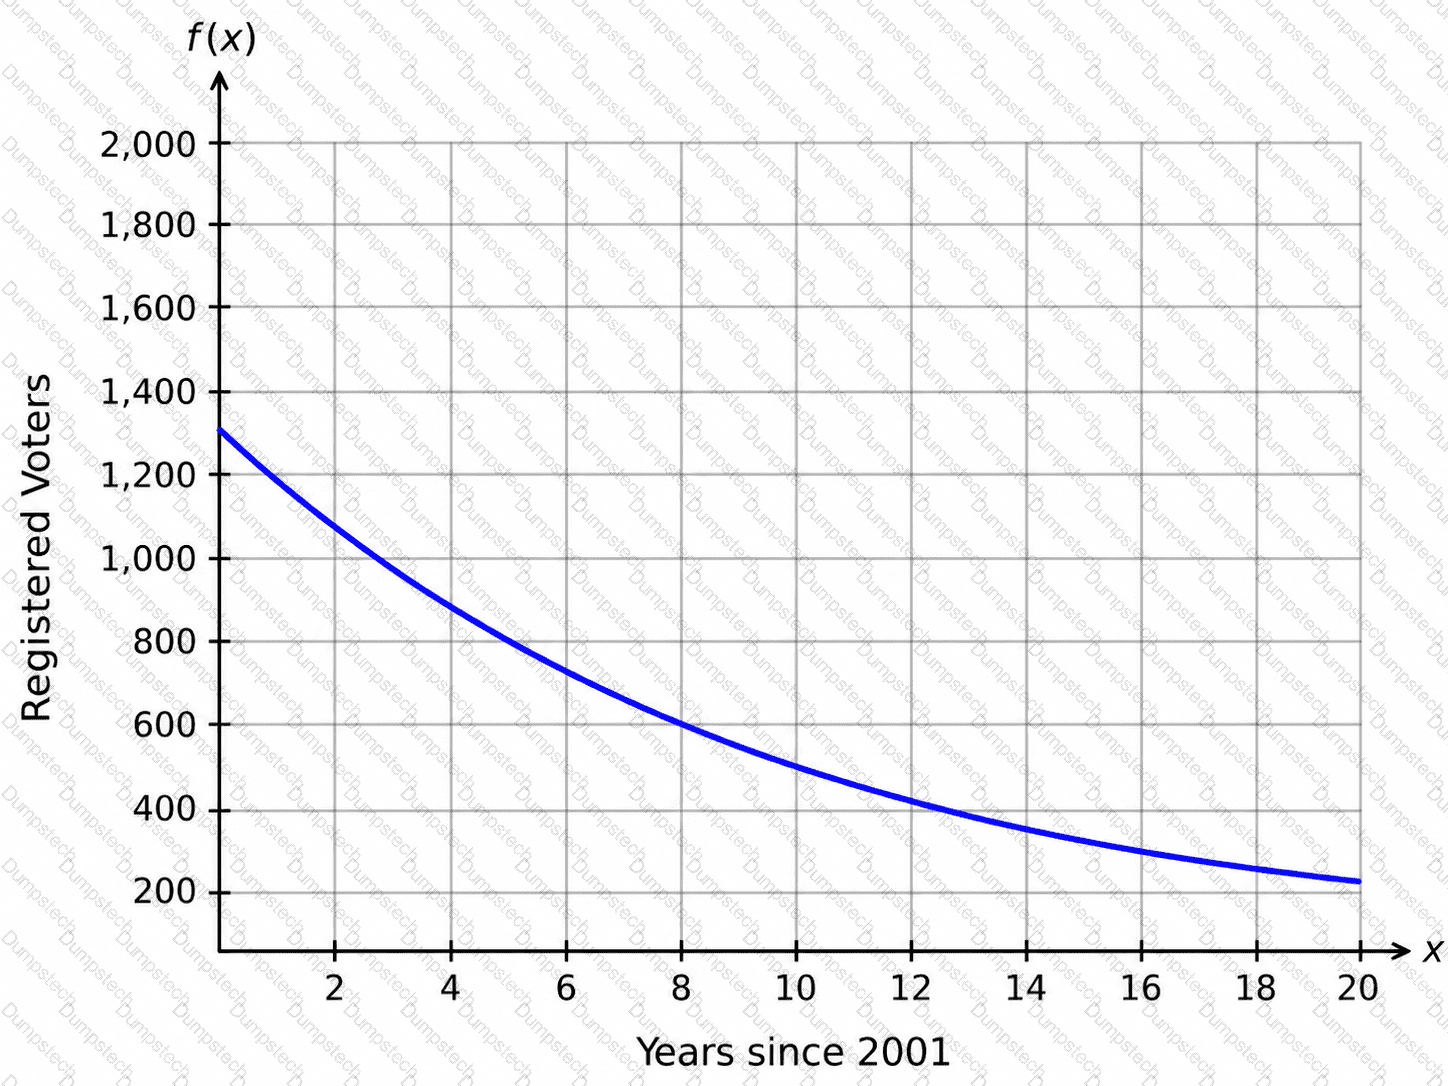
Which time period has the fastest average decrease in the number of registered voters?
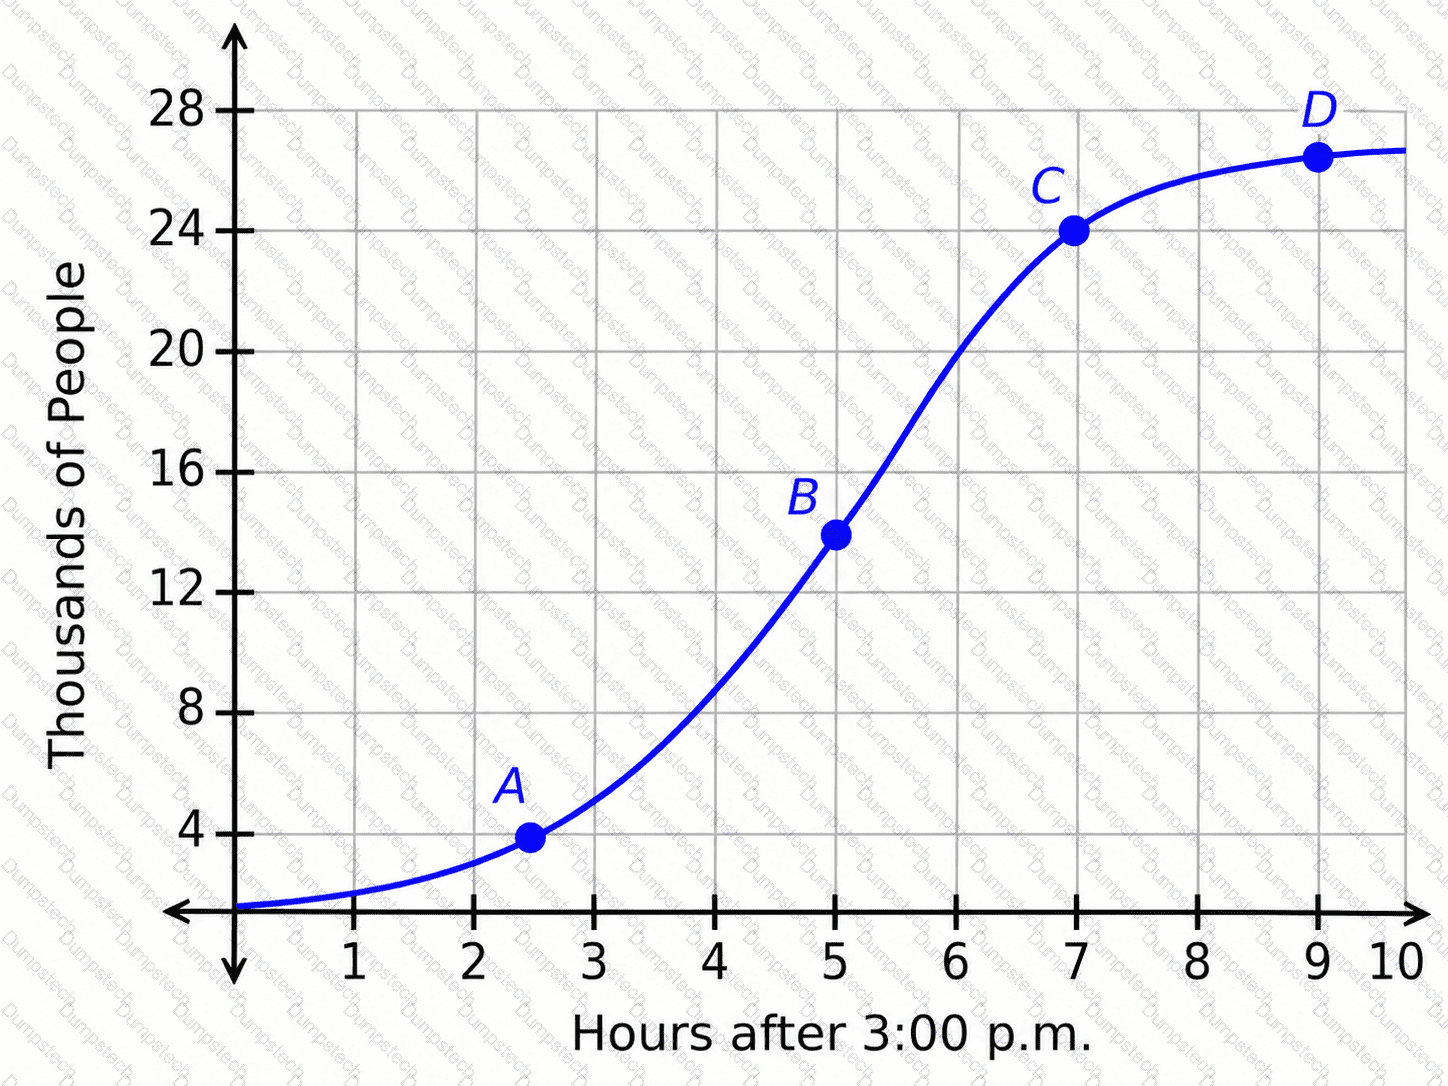
The graph shows the number of people at an event venue after 3:00 p.m., in thousands.
Which rate of change is the greatest?
As regulations change, the number of licensed sellers of a product decreases. The graph models the change in the number of licensed sellers over time.
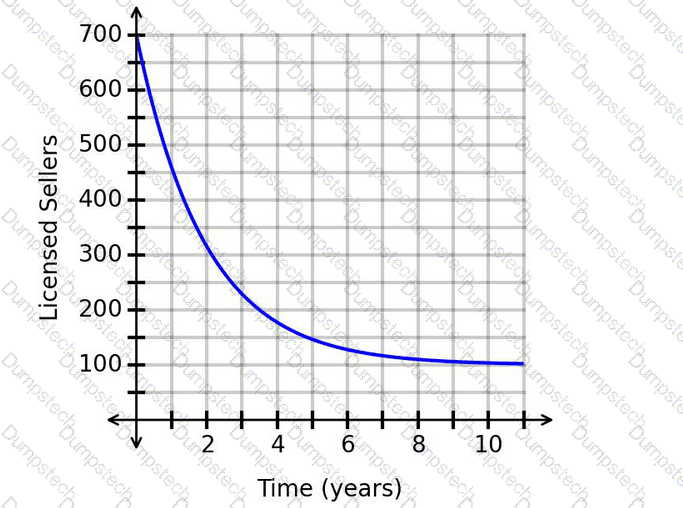
What does the horizontal asymptote mean?